
How do I understand the attendance averages?

 2:31
2:31
"How do I understand the attendance averages?"
The attendance averages provides a set of metrics that describe a person's work patterns. The metrics allow you to compare attendance patterns between people.
To see a person's attendance averages:
- First, select the person on: "Menu", then "People"
- Then tap: "HR", then "Assessment"
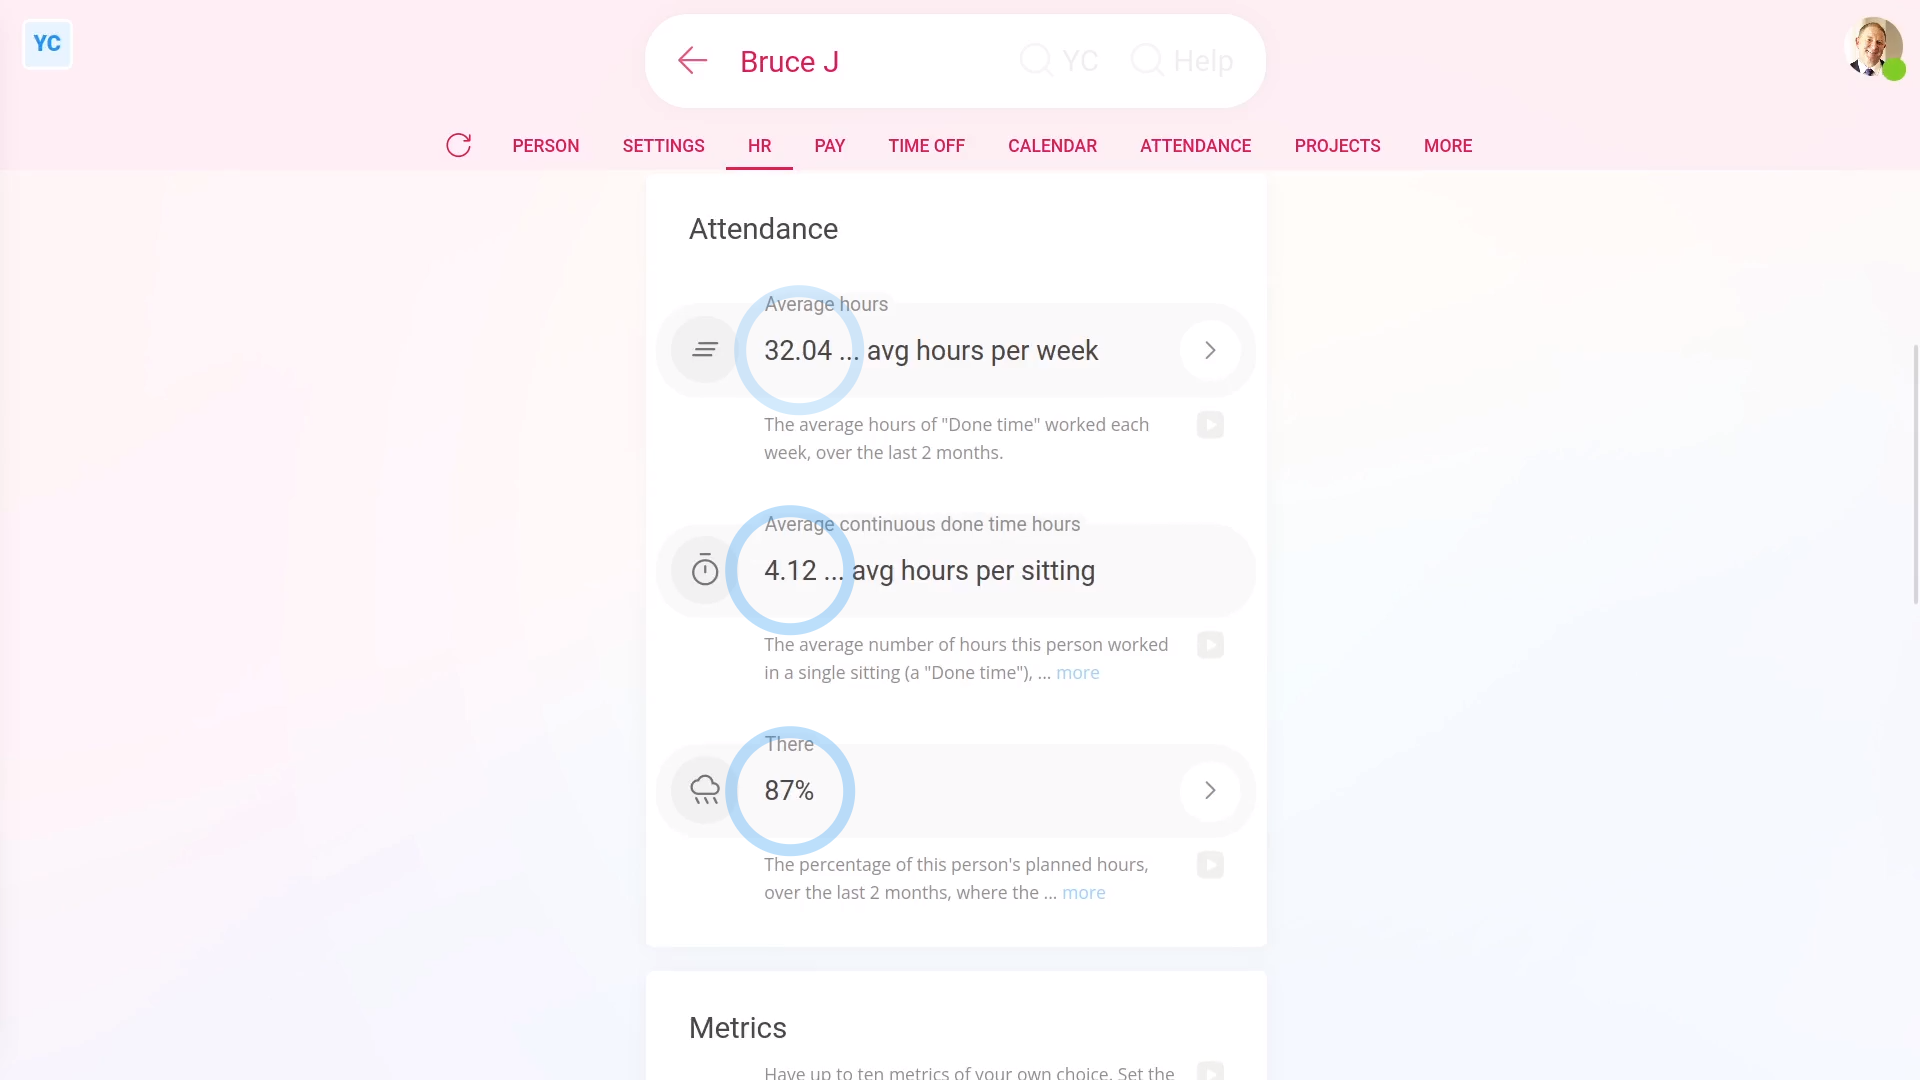
- Then scroll down to the "Attendance" heading.
- And finally, you'll see the person's attendance averages.
Average hours: To understand "Average hours":
- You'll see an estimate of the average hours of "Done time" worked each week by the person.
- The average is based on their attendance over the last two months.
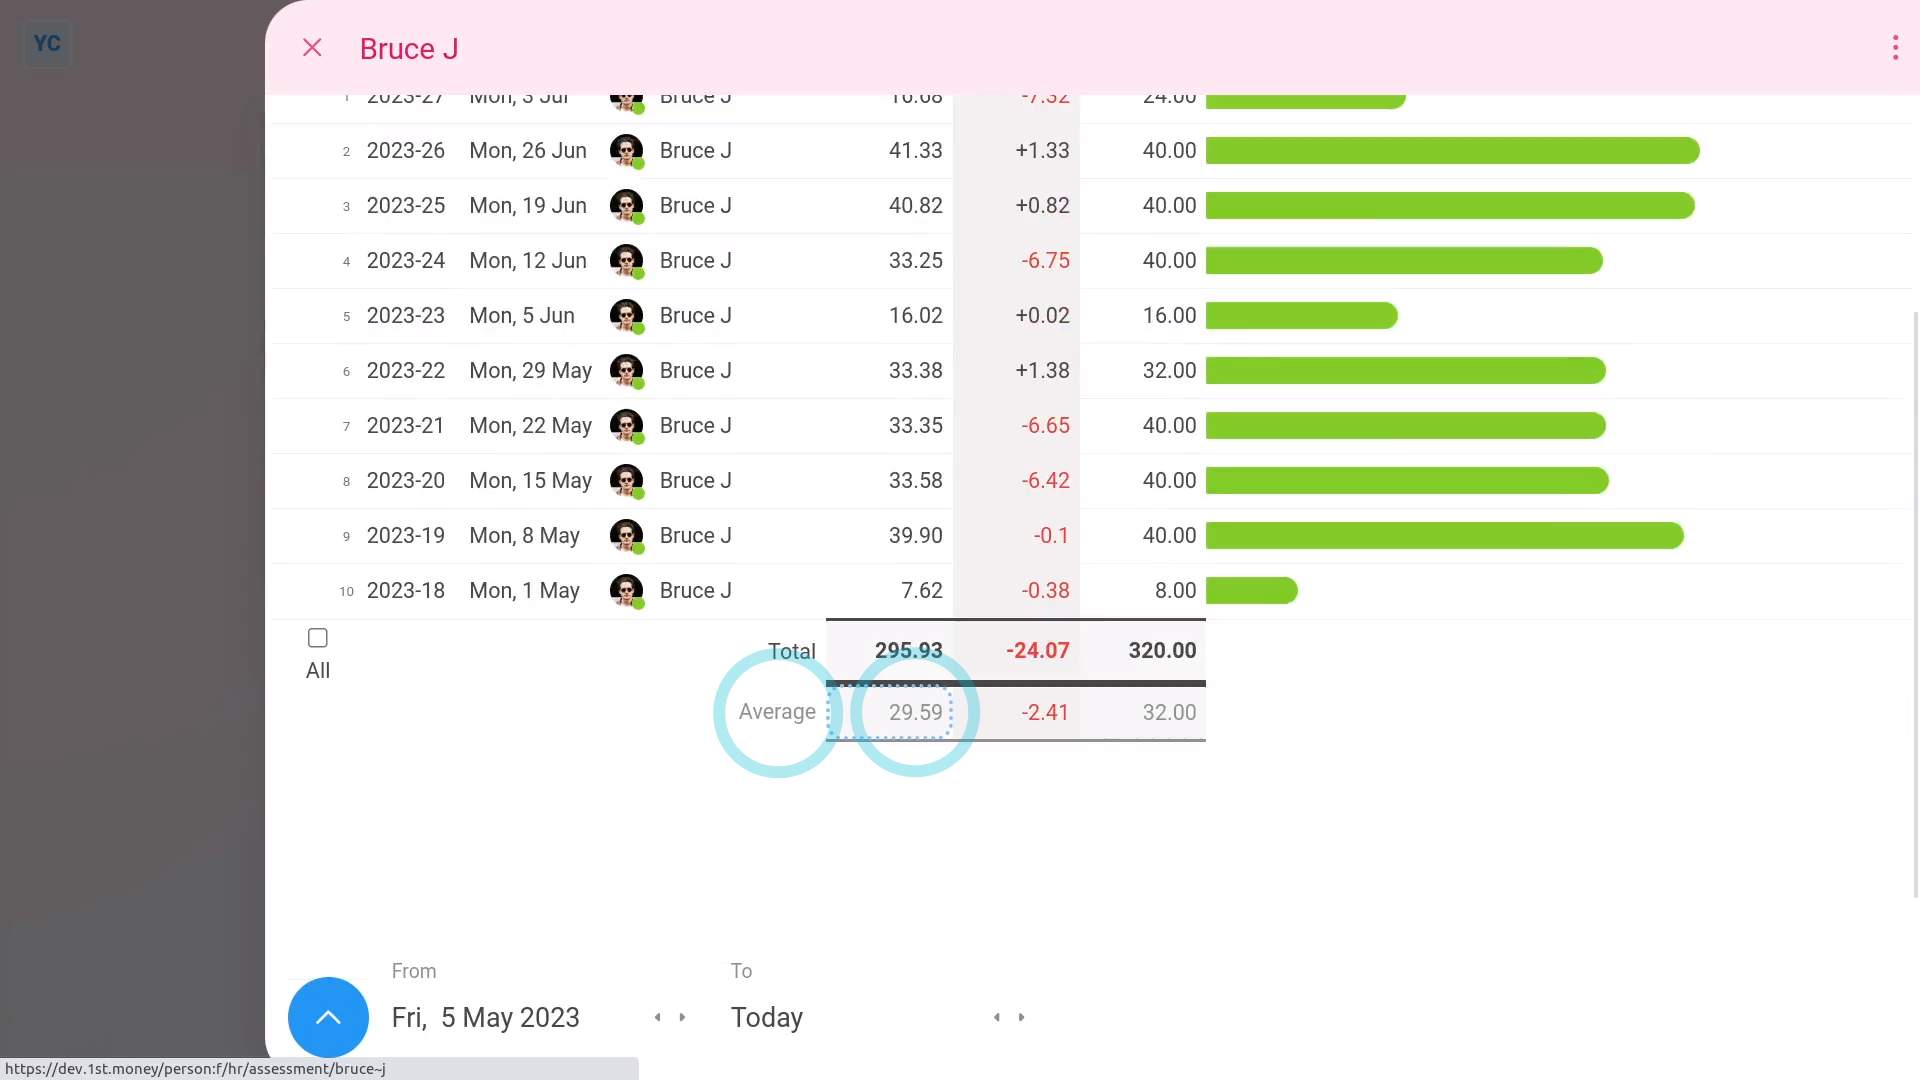
- To see an exact figure, tap the "Edit" button:
- And you'll see it slide out from the right, showing two months worth of weekly "Done time" totals.
- You'll also see the exact overall weekly average (at the bottom).
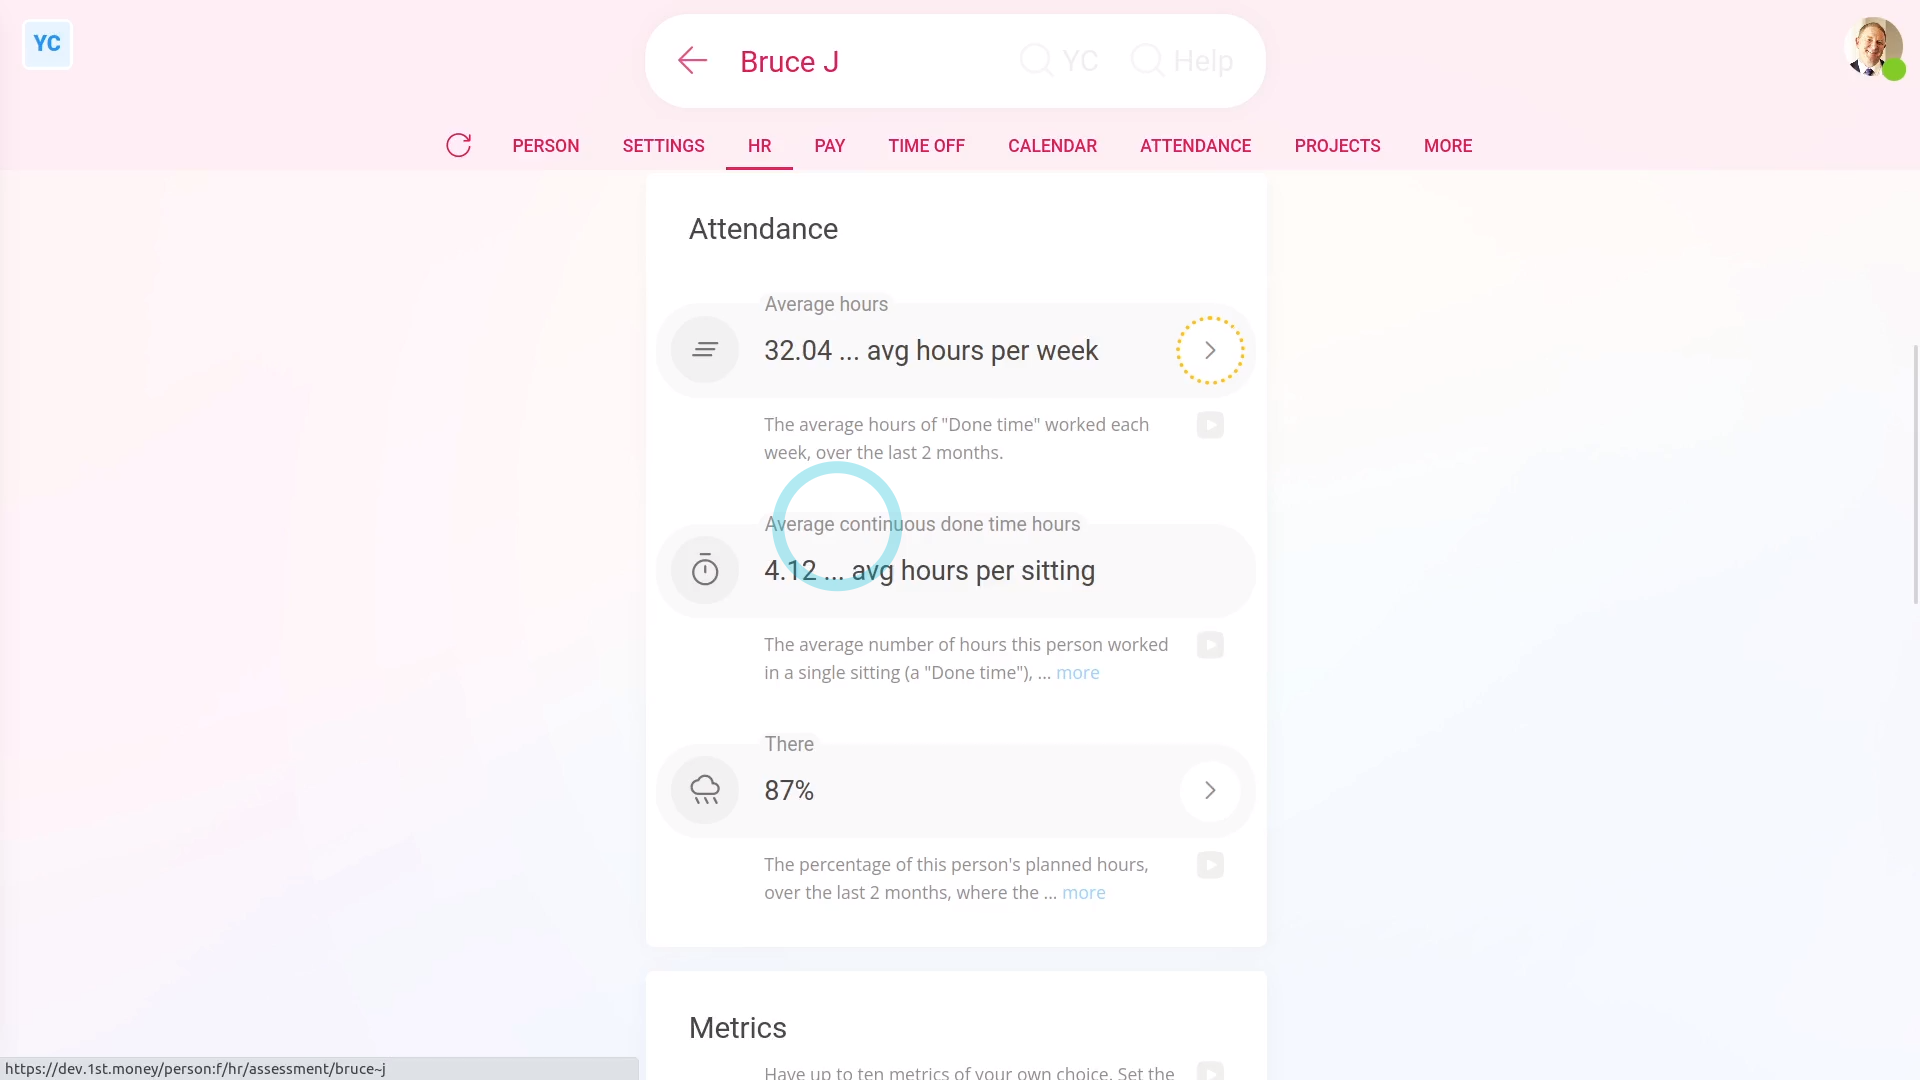
Average continuous done time hours: To understand "Average continuous done time hours":
- You'll see the average "Done time" worked in a single sitting by the person.
- The average is also based on their attendance over the last two months.
- A bigger number means that the person typically works continuously for a longer period, before taking a break.
- For jobs that require concentration, like problem solving, a bigger "Average continuous done time hours" is better.
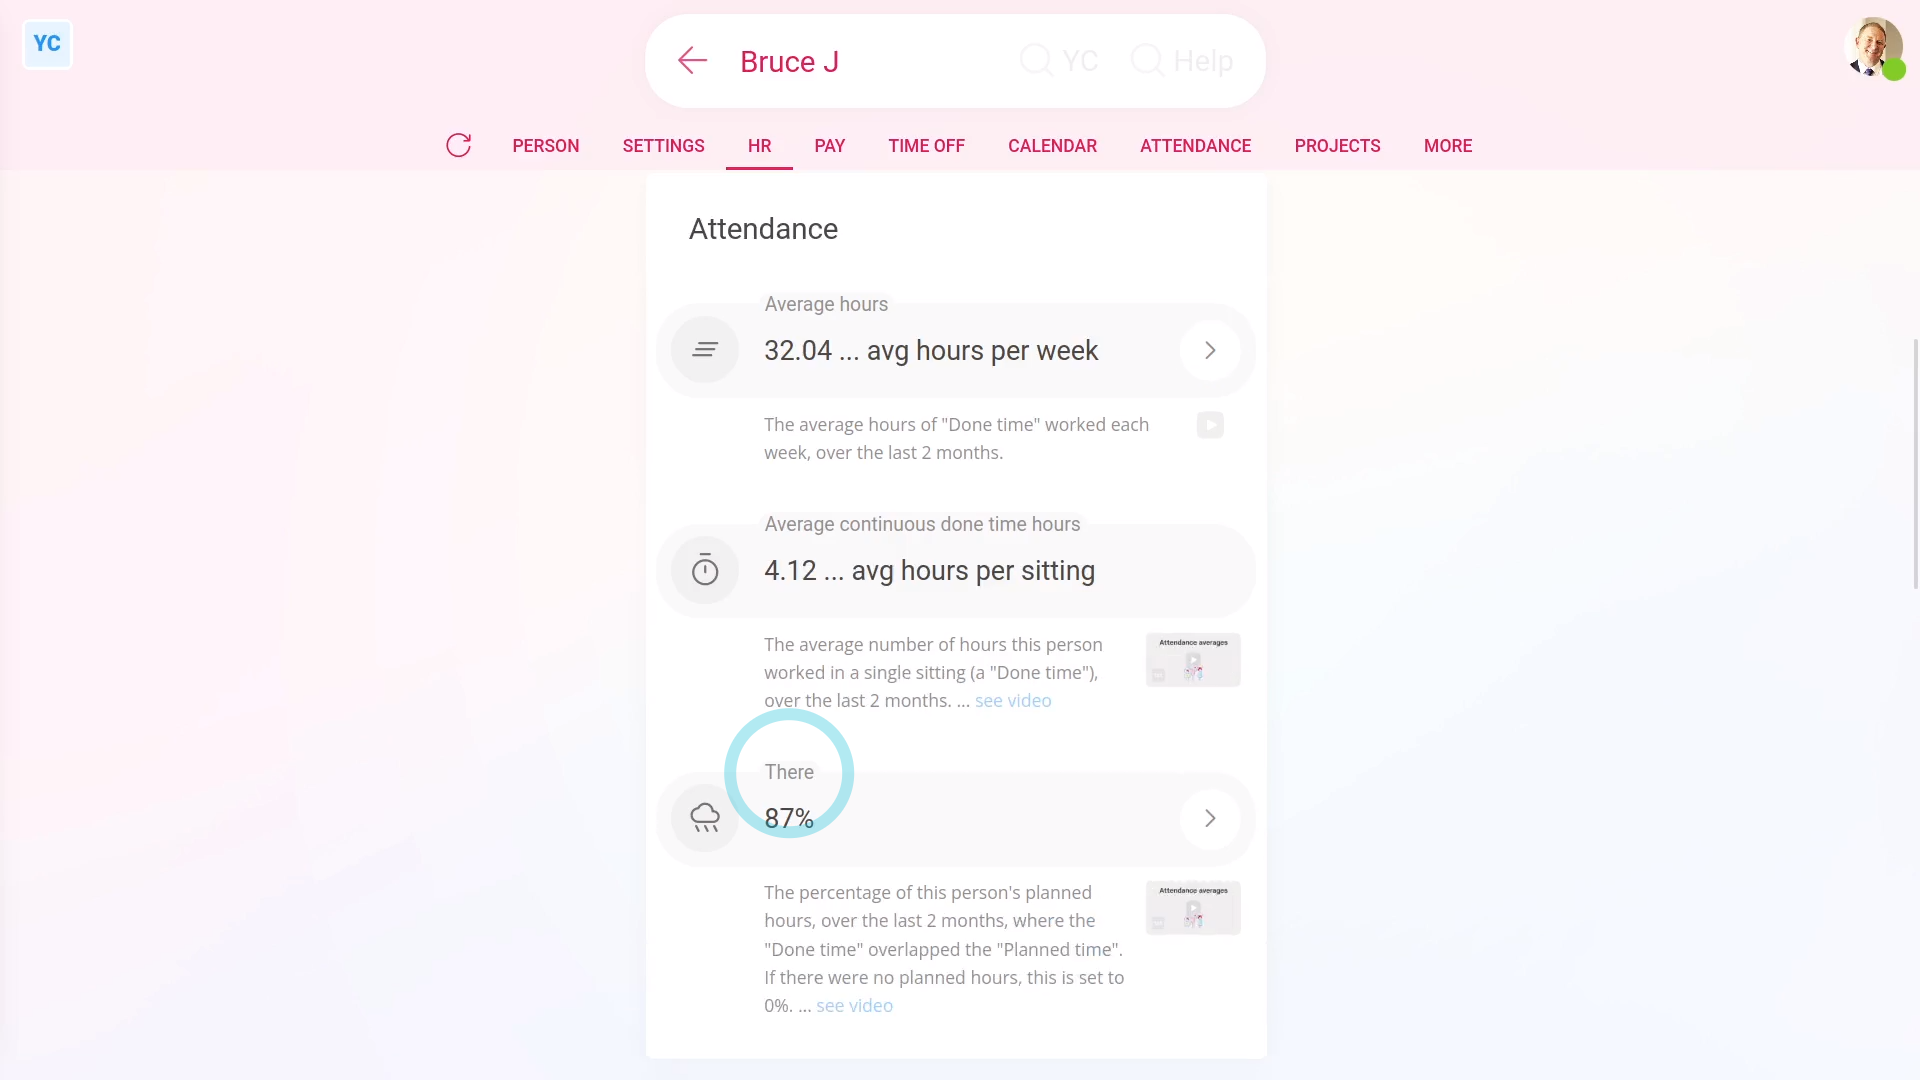
There: To understand a person's "There" percentage:
- You'll see the percentage of the person's planned hours, over the last 2 months, where the "Done time" overlapped the: "Planned time"
- In other words, what percent of the time the person was there, compared to when you planned for them to be there.
- The percentage is also based on attendance over the last two months.
- For jobs that require shift planning, like restaurants and call centres, a "There" percentage closer to 100% is better.
- When there's no planned hours, it shows as 0%.
- When "Show planned times" is turned off, it doesn't show.

To learn more:
- About how to turn on "Show planned times", watch the video on: Turning on planned times
 Turning on planned times
And that's it! That's everything you need to know about attendance averages!